
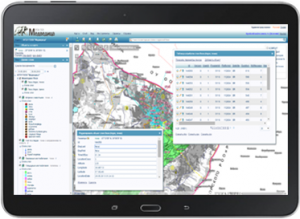
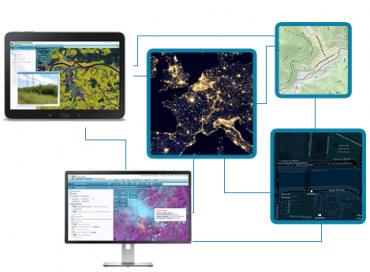
Take the cards with you wherever you go

Use persuasive geospatial information at meetings, presentations or sales

Provide access to your spatial data over the Internet or in the internal network of the enterprise
Access to the platform
- Multi-user access via Internet / Intranet
- Differentiation of access rights by user type: user, editor, administrator
- Support for WMS / WFS / TMS standards
- Protecting and backing up data
- User Logs
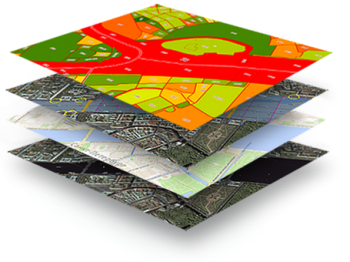
Data Organizer
- Data catalogs - the right way to organize and store your Data
- Multitemporal layers - store historical data and visualize it with calendaк or timeline tools
- Layers tree - a traditional way to organize data in sidebar
- Search your data by layers name, metadata or attribures
Mapping & Co-Working
- Useful for easy mapping and co-working tasks
- Place markers, edit auto geolocated addresses, locate your data and share with co-editors or users
- You can use our new crowdsourcing plugin
Mapping & Co-Working
- Useful for easy mapping and co-working tasks
- Place markers, edit auto geolocated addresses, locate your data and share with co-editors or users
- You can use our new crowdsourcing plugin
Vizualization

Style properties for vector layers - colors, textures, lables, legends etc.

Predefined
Style Library
Style Library

Marker balloons & pop-ups.

Wide range of built-in widgets
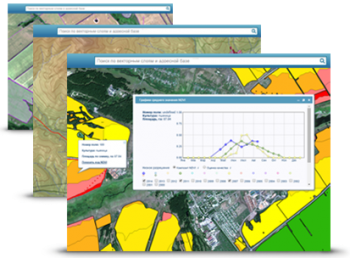
Data Analysis
- Measurement tools with user definable units
- Timelines and charts
- Clusters and heatmaps with calculated numbers for multiple geopoint objects visualization
- Explore you data and connect it with other Geodata sources from your colleagues or from the World
Data Analysis
- Measurement tools with user definable units
- Timelines and charts
- Clusters and heatmaps with calculated numbers for multiple geopoint objects visualization
- Explore you data and connect it with other Geodata sources from your colleagues or from the World
Vector and table data

The common task is to find address or location. We offer GeoMier geocoding service to search by addresses or by location.

Connect your Database and synchronize it with GeoMixer vector layers using our REST API.

Linear shift transformations, editing geometry of selected features,
draw objects or extract features from satellite imagery layers
draw objects or extract features from satellite imagery layers

Search and make a selections by attributes or using SQL expressions. Style your vector layers using filtering by attributes
Sharing & Publication
- GeoMixer API new - compatible with Leaflet - most popular open source library for mobile-friendly interactive maps
- Support of rich text and media
- Create bookmarks to save certain map state and position, layers visibility status and selected date-time period
- Tiny permalinks

Moniotoring and Land management

Geomarketing and Business intelligence

Georegister / Data Catalogs

Marketplace and E-government
System Integration
- GeoMixer API, REST API, GMX API - Leaflet – building blocks for industrial solutions
- REST API – managing objects in the server database
- GeoMixer plugins - third-party developers can write their plugins and connect to GeoMixer plugin interface
- Scalable back-end based on MS SQL Server or Prostgre SQL
- Base maps and services
- OAuth 2.0 support
- WMS / WFS / TWMS services support
Maps & Services
- Base maps: Kosmosnimki Ru, OpenStreetMap (customizable design)
- Commercial providers: Rumap, 2GIS
- Connected services: geocoding, POI, routing
- Overlays: Cadastre map, Wikimapia
- Operative satellite data: MODIS, Landsat, fires, NDVI
Maps & Services
- Base maps: Kosmosnimki Ru, OpenStreetMap (customizable design)
- Commercial providers: Rumap, 2GIS
- Connected services: geocoding, POI, routing
- Overlays: Cadastre map, Wikimapia
- Operative satellite data: MODIS, Landsat, fires, NDVI
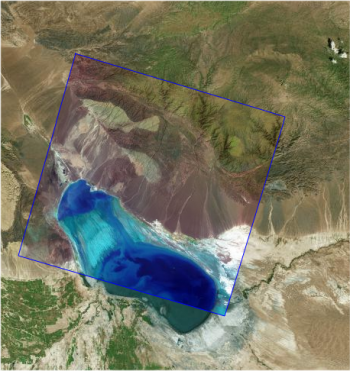
Working with Earth Observation Data
- Multitempotral data catalogues to organize and optimize big data in vector and raster formats
- Metadata profiles
- Auto color contrast calculations & RGB settings
- Cut and download rasters
- Adjustable timeline tool for multitemporal catalogues
- Quicklooks preview and image transformation
- Transparency bar